 KH Lab
Class Project: 3D Analysis
Overview
Weeks 12 and 13 of the class research project: 3D exploration of synapse density and clustering.
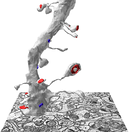
In these weeks you look at your group's dendrite in 3D, in a program called Blender, and ask two questions about where its synapses are:
- Synapse density: how many synapses there are for each micrometer of dendrite length.
- Clustering: whether synapses sit closer together in some stretches of the dendrite than they would by chance.
In Week 12 the class also unblinds the data: you learn the condition and time point of each dendrite. In Week 13 each group is given the figure it makes for the oral presentation in Week 14.
- What you hand in: your saved series, uploaded to Canvas before you leave class. Your results go in your group's presentation and your final lab report (see Assignments).
Blender
Blender is a free 3D program. You use it to look at the dendrite, its spines and its synapses from any side, and to make 3D figures.
To be decided
The Blender steps are not written yet. This page will cover:
- which version of Blender to install, and how;
- how to get your group's dendrite from PyReconstruct into Blender;
- how to measure synapse density and look for clusters;
- how to make the 3D figure for your group's presentation.
Unblinding and group figures
To be decided
How the data are unblinded in Week 12, and which figure each group makes in Week 13.
Saving
Save with Ctrl+S (Mac: Cmd+S), back up your .jser file, and upload it to Canvas before you leave, as in Lab 1.1.