 Kristen Harris Lab
Lab W4: Dendritic Caliber and Spine Density
Overview
As in the assigned reading (Harris et al., 2022), you will characterize the caliber of dendrite d03 in the series ZGBJY. You will collect data to calculate:
- The average microtubule (MT) number for the analyzed d03 dendritic segment.
- Spine density: the number of spines per micrometer (µm) length of dendrite (spines / µm).
- Summed excitatory PSD area per µm length of dendrite (Σ PSD area / µm).
The third measure uses the cfa-traces from Lab 1.2, so finish those first.
Microtubules in the dendritic shaft
First you will count the microtubules in the dendritic shaft at two places along its length, and average the two counts.
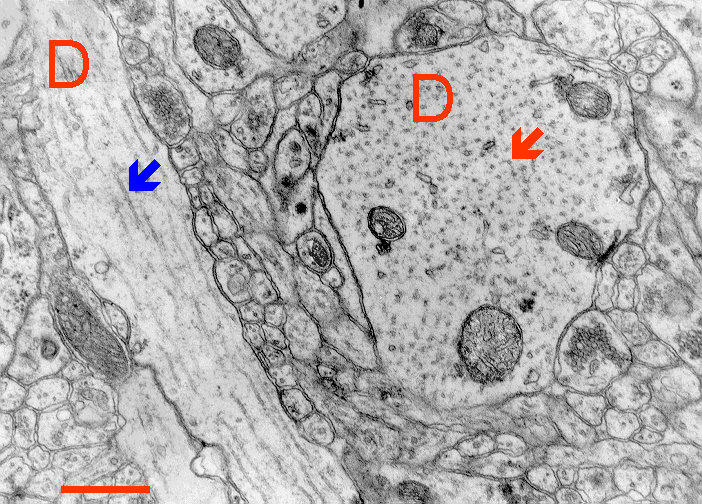
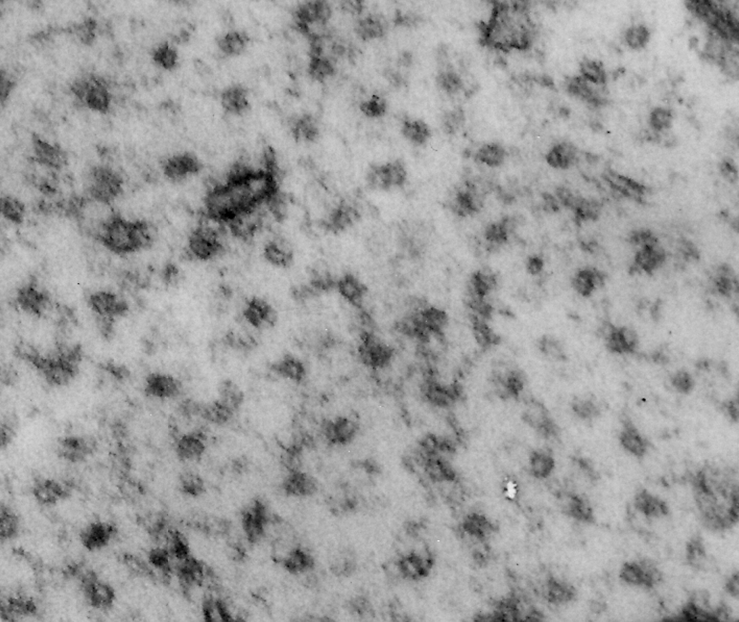
Think of microtubules as long cytoskeletal straws that support the dendritic shaft along its length. They are very long (more than 50 µm), so the MTs you count on section 42 are likely the same ones you count on section 124. The dendrite is cut in cross section, so each MT looks like a small circle. Below is a zoomed-in view of MTs from the SynapseWeb Atlas, 1.18.02.
Set up the MT palette square
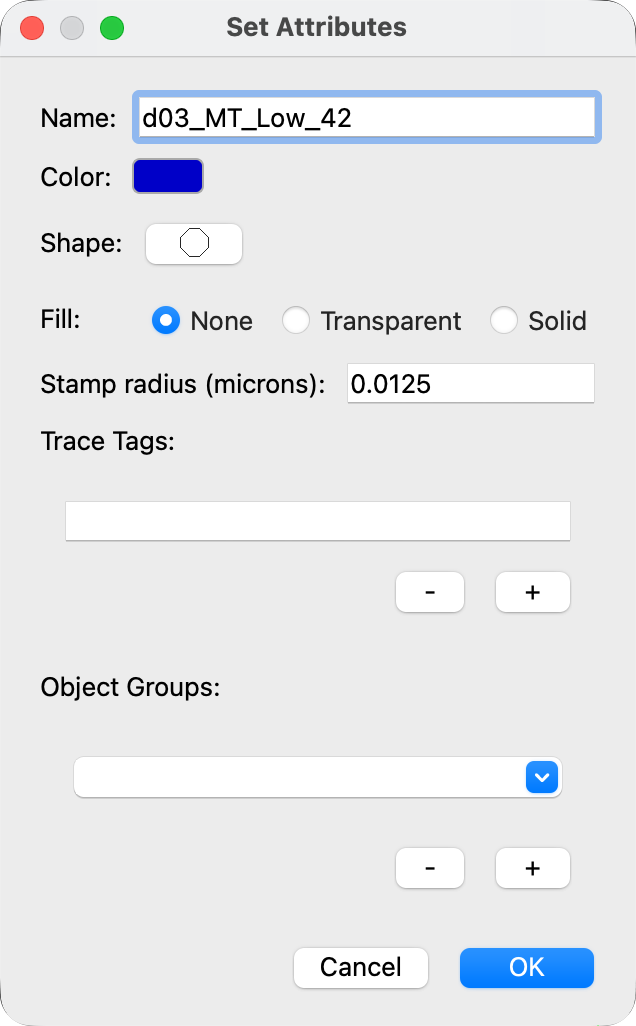
Use these attributes for every MT stamp:
| Attribute | Setting |
|---|---|
| Color | dark blue |
| Shape | circle |
| Fill | None |
| Stamp radius (microns) | 0.0125 (an MT is about 25 nm across) |
- Right-click an unused palette square. The Set Attributes dialog opens.
- In Name, type
d03_MT_Low_42. - Click Color and choose dark blue.
- Click Shape and choose the circle.
- In Fill, choose None.
- In Stamp radius (microns), type
0.0125. - Click OK.
Stamp the microtubules
Place one stamp on each MT you can see inside d03, on the sections in this table:
| MT stamp name | Section | Tool |
|---|---|---|
| d03_MT_Low_42 | 42 | Stamp  |
| d03_MT_High_124 | 124 | Stamp |
- Go to Section > Go to section... (Ctrl+G; Mac: Cmd+G), type
42and click OK. - Click the d03_MT_Low_42 palette square.
- Click the Stamp tool (S) in the tool palette.
- Click once on each MT inside the dendrite d03. Each click places one stamp.
- Before you stamp a dark circle, follow it up and down for 2 to 3 sections (Page Up, Page Down). A true MT continues through the sections. This keeps you from stamping something that only looks like an MT.
- Go to section 124. Right-click the palette square, change Name to
d03_MT_High_124, and click OK. - Stamp each MT inside d03 on section 124 the same way.
Each count is the total for one section. Do not add the two sections together.
Optional: Dr. Harris's check
Stamping the same MTs on the next section helps you tell which MT you are counting. If you do this, use a separate name for each section: d03_MT_Low_41 on section 41 and d03_MT_High_125 on section 125. Because each name includes its section number, the stamps on different sections are counted separately.
Average microtubule number
MTs do end eventually, and they can be hard to identify, so an average of two places gives a more accurate value.
- Go to Lists > Object list (Ctrl+Shift+O; Mac: Cmd+Shift+O).
- In the Object List, click Filter > Regex filter....
- Replace
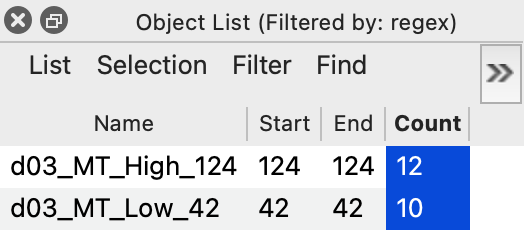
.*withd03_MT.*and click OK. The list shows only your MT stamps. - Read the Count column. It is the number of stamps, so it is the MT count for the section in each name.
- Average the two counts: (d03_MT_Low_42 + d03_MT_High_124) / 2. In the made-up example below, counts of 12 and 10 average to 11.
If you also stamped sections 41 and 125, average all four counts, or only the two for sections 42 and 124.
Spine density
Spine density is the number of spines per µm length of dendrite.
The length of the analyzed d03 segment was measured for you with a z-trace. A z-trace is a line that follows the dendrite through the sections; its Distance is the length along the dendrite, in µm.
-
Go to Lists > Z-trace list (Ctrl+Alt+Z; Mac: Cmd+Option+Z).
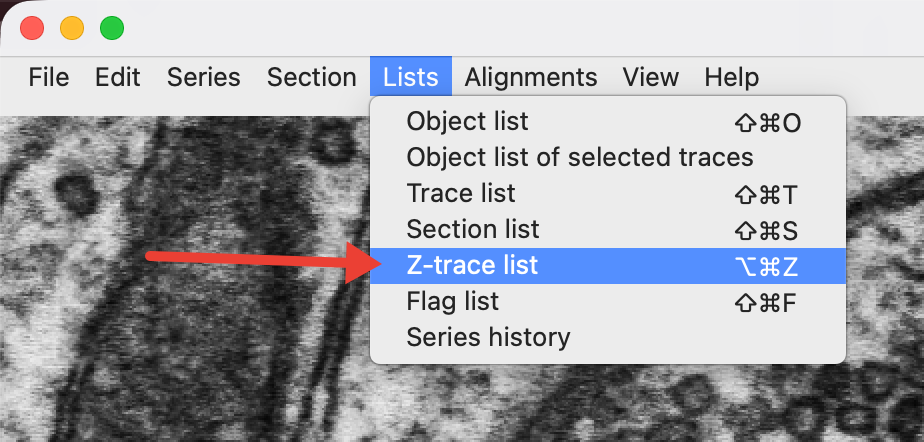
Lists > Z-trace list. -
Find the row d03_zlen_smooth10. Its Distance is 13.81362, so the segment is 13.8 µm long. Use 13.8 µm as the dendrite length in every calculation in this lab.
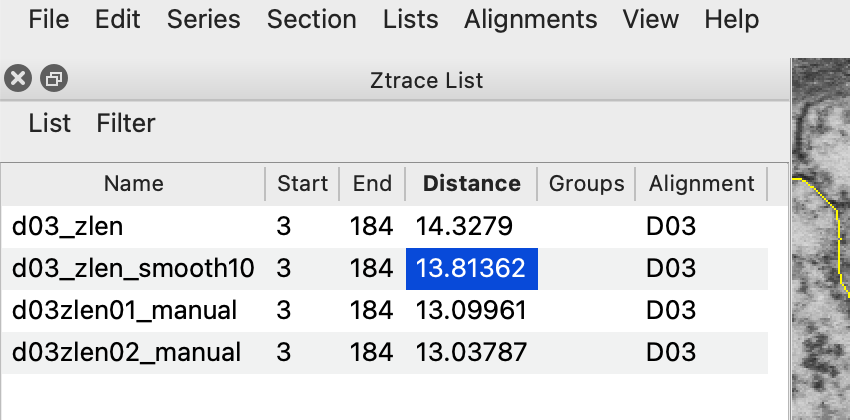
The Ztrace List. Use d03_zlen_smooth10 (13.8 µm). -
Count the spines: count the p-stamps (d03p##) in the Object List with the regex filter
d03p.*. - Subtract the p-stamps whose names end in
_shaft. These mark shaft synapses, not spines. The regex filterd03p.*_shaftlists them. - Calculate spine density: number of d03 spines / 13.8 µm = ___ spines / µm.
Summed PSD area per micrometer
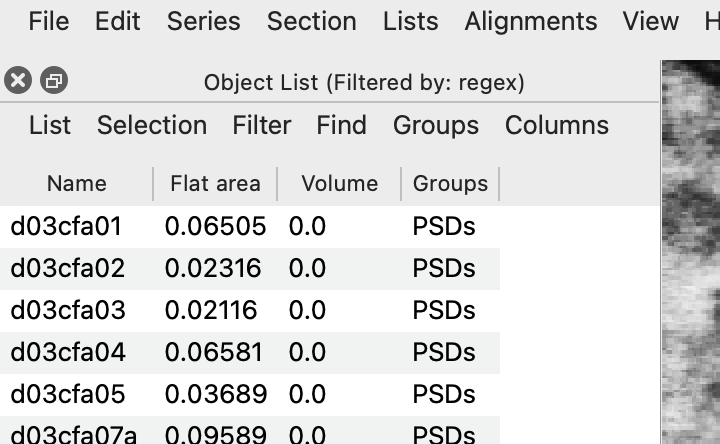
- In the Object List, filter with the regex
d03cfa.*to show every cfa-trace on d03 (see Lab 1.2). - Make sure the Flat area column is showing. If it is not, click Columns > Set columns..., check Flat area, and click OK.
- Copy the cfa names and their flat area values into your metadata spreadsheet. You can select the cells and press Ctrl+C (Mac: Cmd+C), then paste.
- Calculate: Σ PSD area / length of d03 = (sum of all flat area values) / 13.8 µm = ___ µm² per µm length of dendrite.
Saving
Save with Ctrl+S (Mac: Cmd+S), back up your .jser file, and upload it to Canvas for attendance, as in Lab 1.1.
References
- Harris KM, Hubbard DD, Kuwajima M, Abraham WC, Bourne JN, Bowden JB, Haessly A, Mendenhall JM, Parker PH, Shi B, Spacek J (2022). Dendritic spine density scales with microtubule number in rat hippocampal dendrites. Neuroscience 489:84-97. doi:10.1016/j.neuroscience.2022.02.021
- SynapseWeb Atlas, 1.18.02 (microtubules).